
Operations & SOPs
AI KPI / Financial Dashboard Spec
Get dashboard spec - just enter business, metrics, audience.
Free to previewNo signupYou get: A ready-to-use dashboard spec
01
How it works.
KPI / Financial Dashboard Spec: provide business, metrics, audience and get a complete dashboard spec in minutes - including KPIs, definitions, sources. Free AI workflow, no signup required to preview.
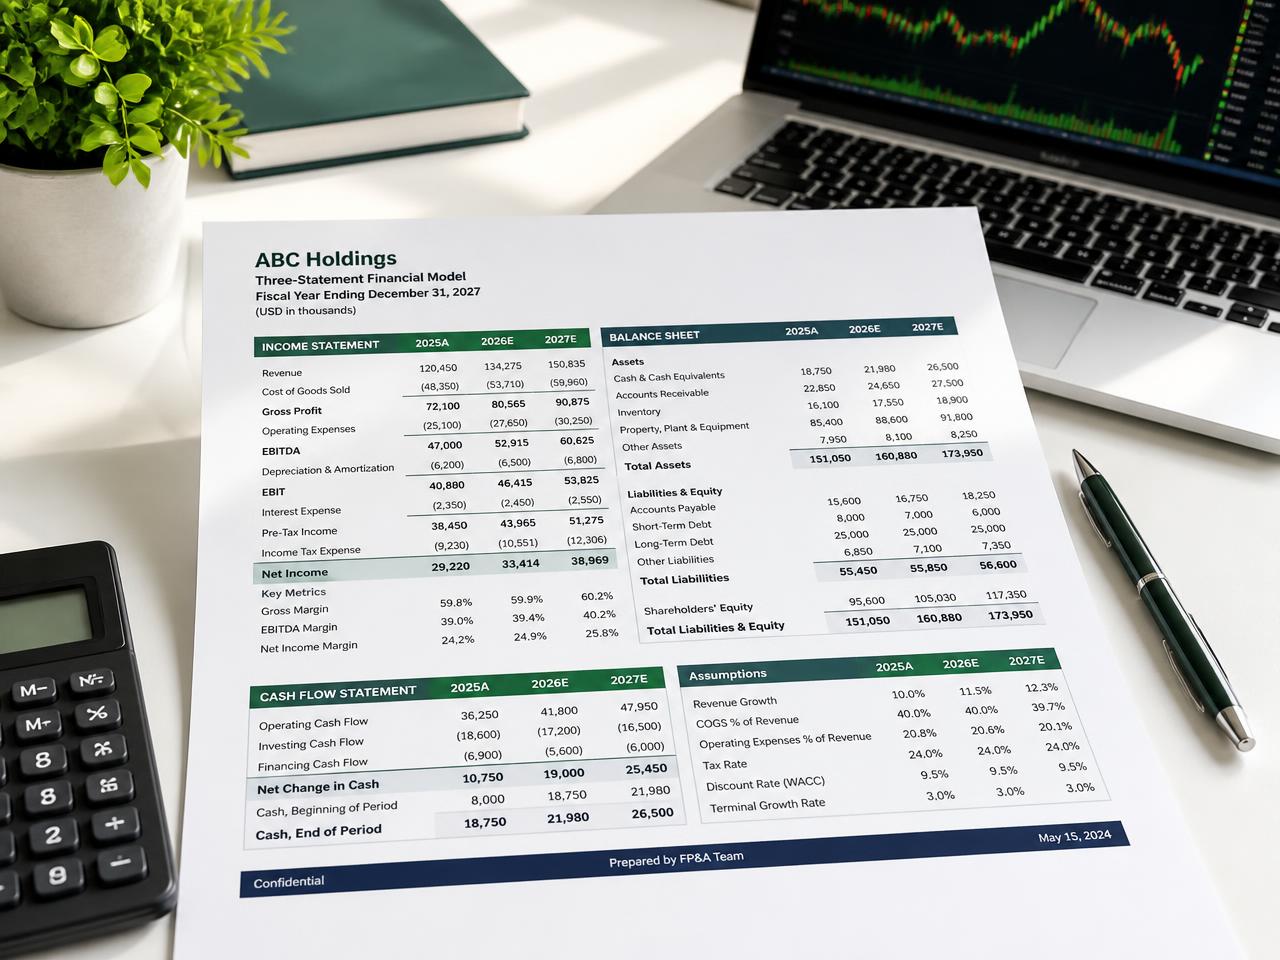 Operations & SOPs
What you provide
Draft my ready-to-use dashboard spec

02
Dashboard spec: metric, definition, source, target, visualization, cadence, owner.
Format & standard
03
What good looks like.
01
CriteriaWhat it must include
- 01Audience-tailored KPIs (exec vs. ops)
- 02metric definitions and formulas with data source
- 03primary financial KPIs (revenue, gross margin, EBITDA, cash/runway, AR DSO) plus operational drivers
- 04targets/benchmarks and variance vs. plan
- 05visualization type per metric
- 06refresh cadence
- 07drill-down/segmentation
- 08alert thresholds
- 09single source of truth
02
QualitySignals of expertise
- ★Tailors metric set to audience and decisions
- ★defines each metric's formula and source to avoid ambiguity
- ★pairs KPIs with targets and trend, not just current value
03
PitfallsCommon mistakes
- ×Too many vanity metrics
- ×undefined/ambiguous metrics
- ×no targets or trend
- ×wrong chart types
 Driver based
 Monthly detail
 Scenario ready
04
You might also like.
Operations & SOPs
Accounts Payable Process
Get AP process - just enter volume, systems, approvals.
Try it →
Operations & SOPs
Audit Preparation Checklist
Get audit prep - just enter entity, scope, timeline.
Try it →
Operations & SOPs
Board Meeting Pack
Get board pack outline - just enter company metrics, agenda items, decisions needed.
Try it →


Ready when you are
Get your ready-to-use dashboard spec.
Answer a few questions and get a finance-ready document you can review, edit and share today.
Get your ready-to-use dashboard spec