
Audits, Analyses & Reports
AI Procurement & Vendor Spend Analysis
Get spend analysis report - just enter spend data, vendors, categories.
Free to previewNo signupYou get: A ready-to-use spend analysis report
01
How it works.
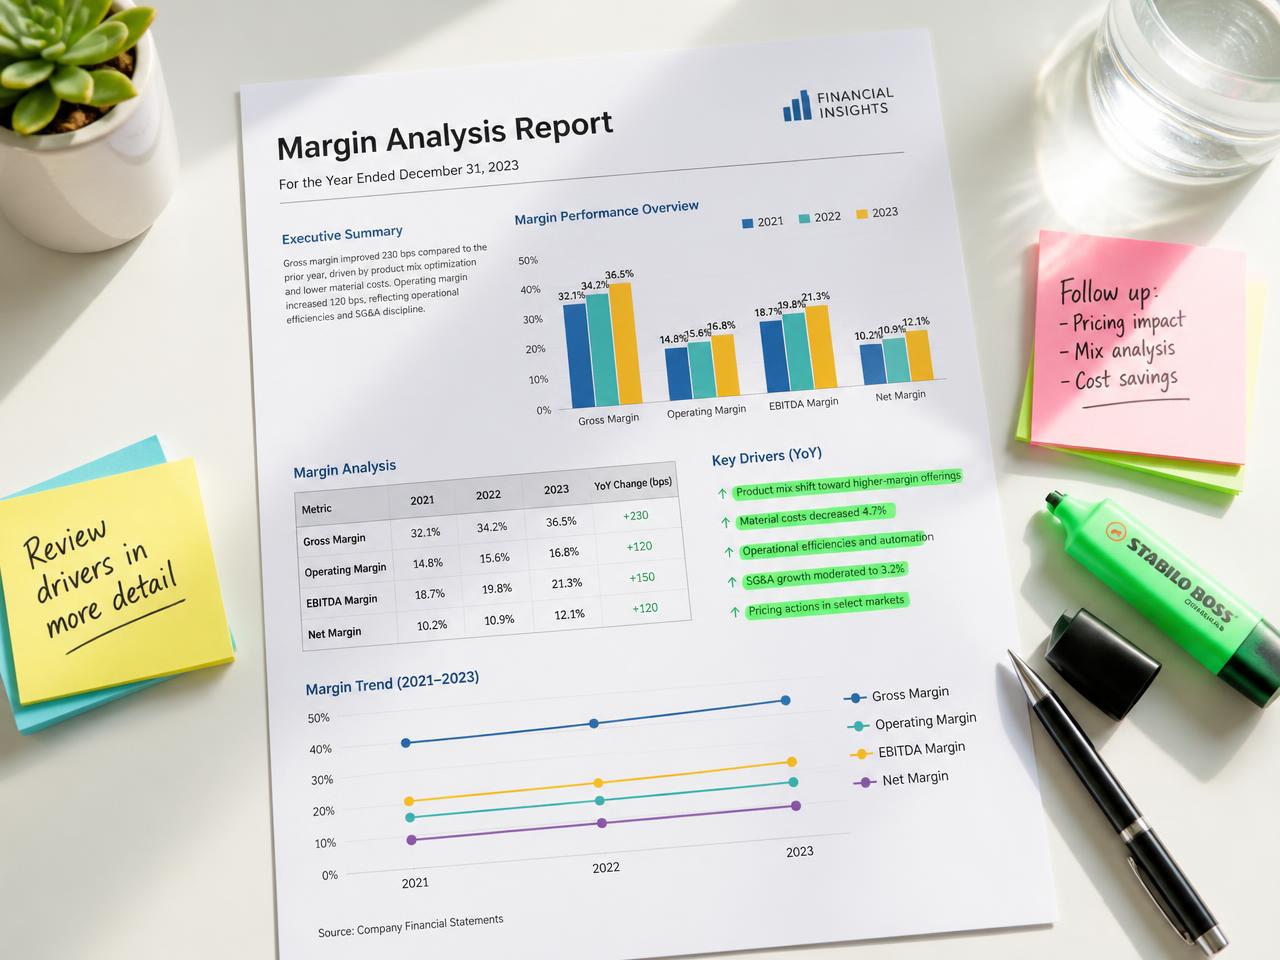
Procurement & Vendor Spend Analysis: provide spend data, vendors, categories and get a complete spend analysis report in minutes - including category breakdown, consolidation opportunities, contract leakage. Free AI workflow, no signup required to preview.
 Audits, Analyses & Reports
What you provide
Draft my ready-to-use spend analysis report
02
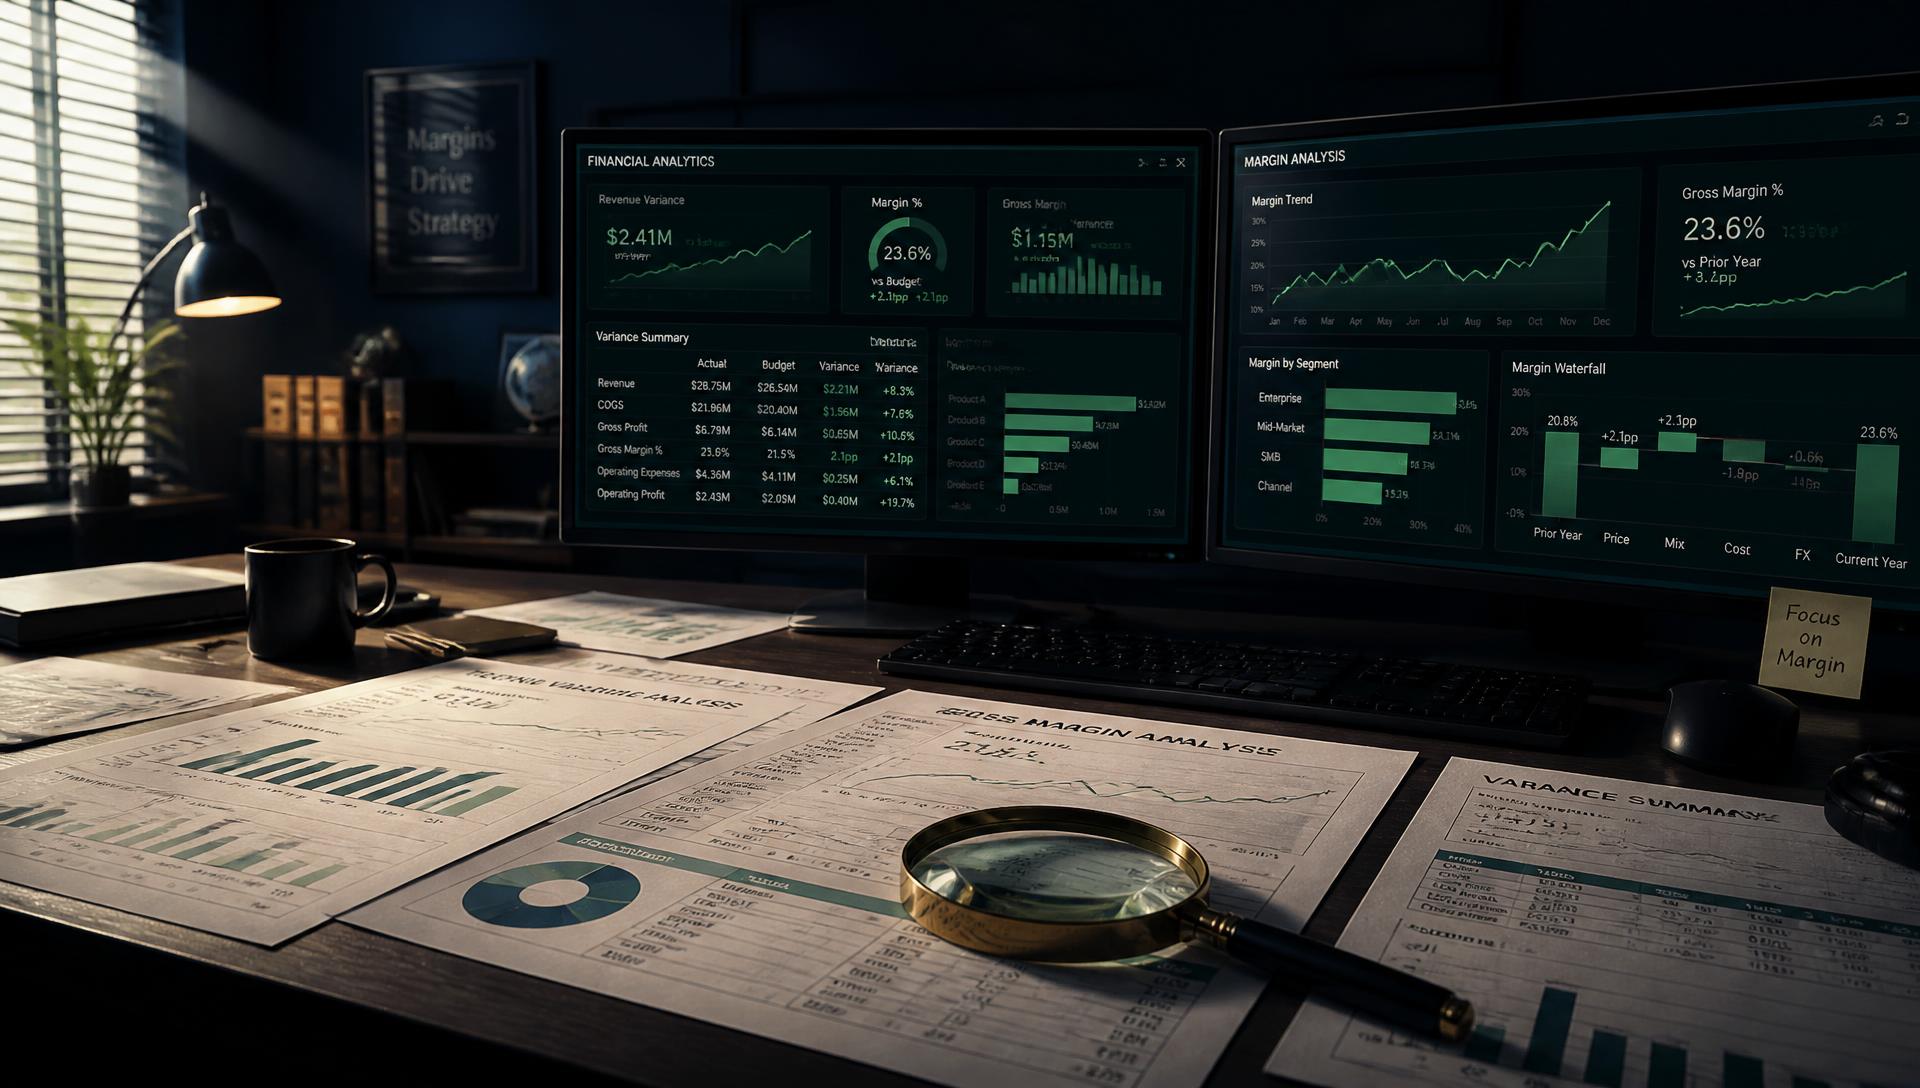
Spend-cube analysis (category x vendor x cost-center) + savings opportunity by lever.
Format & standard
03
What good looks like.
01
CriteriaWhat it must include
- 01Spend taxonomy by category (UNSPSC-style) and by vendor
- 02Pareto/ABC top-vendor concentration
- 03tail-spend and maverick-spend identification
- 04price variance for same SKU across vendors
- 05contract-coverage vs off-contract %
- 06payment-terms and early-pay opportunity
- 07consolidation/rationalization savings quantified
- 08addressable vs non-addressable spend
- 09savings by lever (consolidation, renegotiation, demand mgmt)
02
QualitySignals of expertise
- ★Tail-spend and maverick-spend terminology, spend-under-management %, category-tree taxonomy, savings-leakage vs realized savings
03
PitfallsCommon mistakes
- ×No category normalization (same vendor split across names)
- ×ignoring tail spend
- ×savings claimed without baseline
 Reviewed
 Traceable
 Decision ready
04
You might also like.
Audits, Analyses & Reports
Break-Even Analysis
Get break-even analysis - just enter costs, price, volume.
Try it →
Audits, Analyses & Reports
Cost Reduction Analysis
Get cost reduction plan - just enter expense breakdown, contracts, headcount.
Try it →
Audits, Analyses & Reports
Pricing Margin Analysis
Get margin analysis - just enter costs, prices, mix.
Try it →


Ready when you are
Get your ready-to-use spend analysis report.
Answer a few questions and get a finance-ready document you can review, edit and share today.
Get your ready-to-use spend analysis report