
Audits, Analyses & Reports
AI Subscription Revenue Metrics
Get saaS metrics report - just enter billing data summary, cohorts.
Free to previewNo signupYou get: A ready-to-use saaS metrics report
01
How it works.
Subscription Revenue Metrics: provide billing data summary, cohorts and get a complete saaS metrics report in minutes - including MRR movements, churn/NRR math, cohort retention. Free AI workflow, no signup required to preview.
 Audits, Analyses & Reports
What you provide
Draft my ready-to-use saas metrics report

02
SaaS metrics report (MRR bridge, NRR/GRR, CAC payback, cohorts, Rule-of-40).
Format & standard
03
What good looks like.
01
CriteriaWhat it must include
- 01MRR/ARR with new/expansion/contraction/churned MRR bridge
- 02gross and net revenue retention (NRR/GRR)
- 03logo vs revenue churn
- 04ARPA/ACV
- 05CAC, CAC payback, LTV:CAC
- 06cohort retention curves
- 07quick ratio
- 08magic number/sales efficiency
- 09rule-of-40
- 10bookings vs billings vs revenue distinction
- 11period-over-period trends
02
QualitySignals of expertise
- ★NRR >100% expansion framing and the MRR movement bridge
- ★distinguishing recognized revenue from bookings/billings
- ★cohort retention and Rule-of-40
03
PitfallsCommon mistakes
- ×Conflating bookings/MRR/revenue
- ×logo churn only (ignoring net revenue retention)
- ×no cohort/expansion breakdown
 Reviewed
 Traceable
 Decision ready
04
You might also like.
Audits, Analyses & Reports
Break-Even Analysis
Get break-even analysis - just enter costs, price, volume.
Try it →
Audits, Analyses & Reports
Cost Reduction Analysis
Get cost reduction plan - just enter expense breakdown, contracts, headcount.
Try it →
Audits, Analyses & Reports
Pricing Margin Analysis
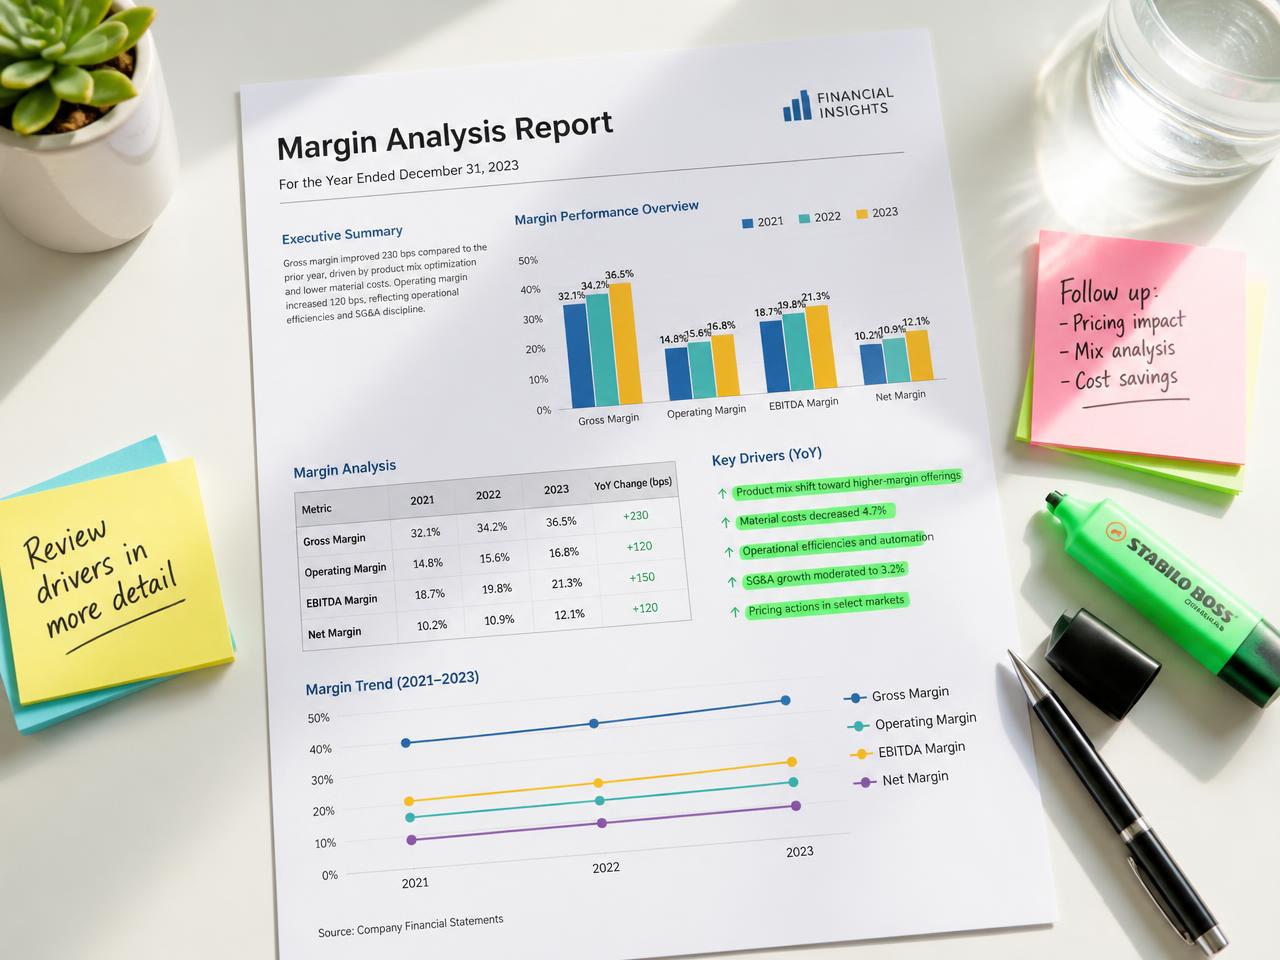
Get margin analysis - just enter costs, prices, mix.
Try it →


Ready when you are
Get your ready-to-use saas metrics report.
Answer a few questions and get a finance-ready document you can review, edit and share today.
Get your ready-to-use saas metrics report