
Financial Docs & Models
AI Financial Statement Analyzer
Get financial health report - just enter p&l, balance sheet, cash flow data.
Free to previewNo signupYou get: A ready-to-use financial health report
01
How it works.
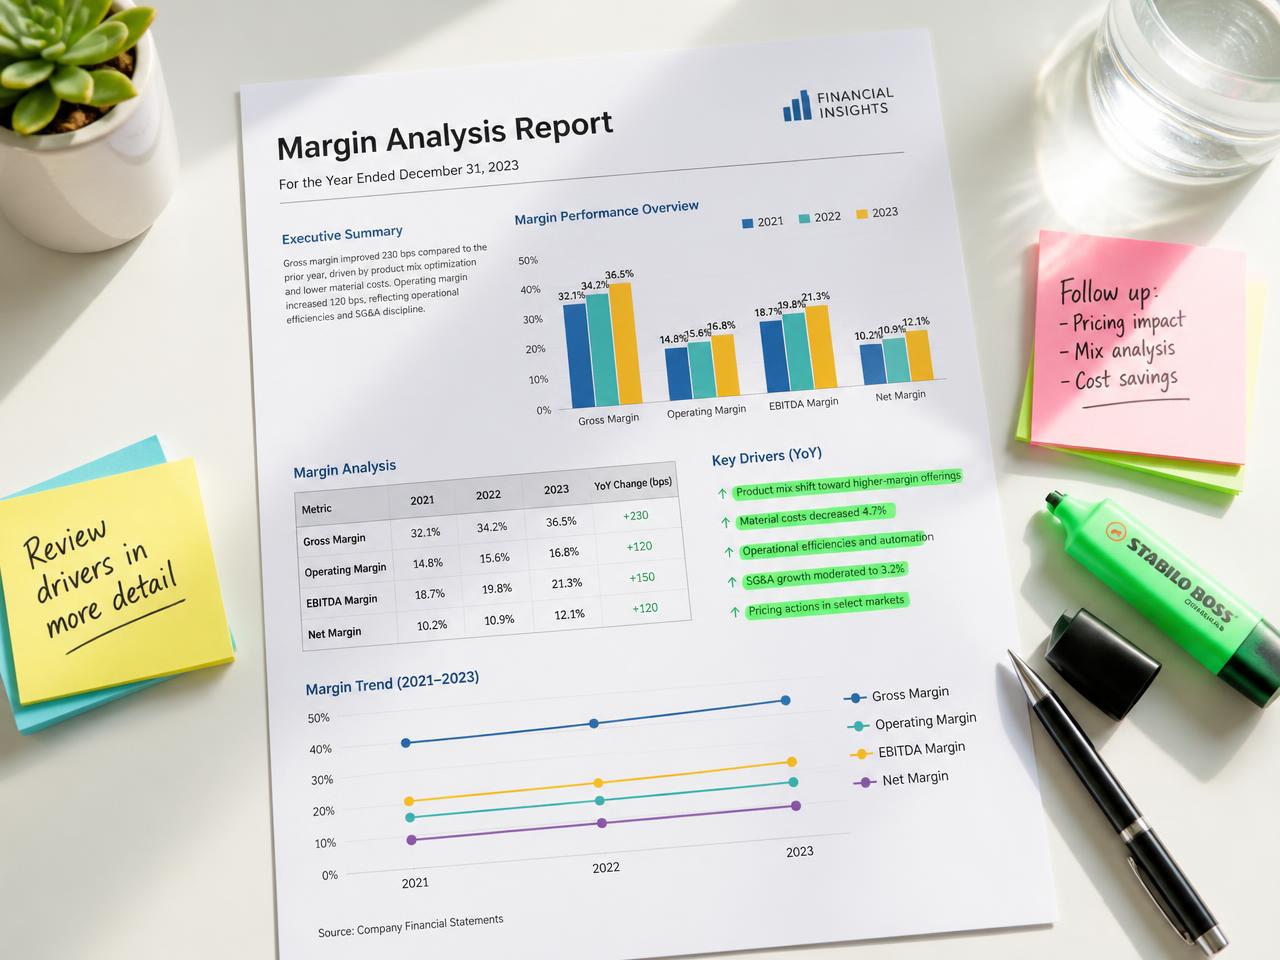
Financial Statement Analyzer: provide p&L, balance sheet, cash flow data and get a complete financial health report in minutes - including ratio analysis, trend diagnosis, liquidity/solvency verdicts. Free AI workflow, no signup required to preview.
 Financial Docs & Models
What you provide
Draft my ready-to-use financial health report

02
Ratio dashboard + common-size statements + trend; standard financial-analysis framework.
Format & standard
03
What good looks like.
01
CriteriaWhat it must include
- 01Liquidity ratios (current, quick), leverage (debt-to-equity, interest coverage), profitability (gross/operating/net margin, ROA, ROE), efficiency (inventory/receivables/payables turnover, cash-conversion cycle), DuPont decomposition
- 02horizontal (YoY) and vertical (common-size) analysis
- 03cash-flow quality (CFO vs net income, FCF)
- 04trend and industry-benchmark comparison
- 05red flags and drivers
02
QualitySignals of expertise
- ★DuPont ROE breakdown, cash-conversion-cycle math, accrual-quality/CFO-to-NI check, common-size statements, benchmark vs NAICS peers
03
PitfallsCommon mistakes
- ×Listing ratios with no benchmark or trend
- ×ignoring cash flow vs accrual earnings
- ×no interpretation/drivers
 Reviewed
 Traceable
 Decision ready
04
You might also like.
Financial Docs & Models
Budget Variance Report
Get variance analysis report - just enter budget, actuals, period.
Try it →
Financial Docs & Models
Burn Rate & Runway Tracker
Get runway tracker spec - just enter cash, monthly spend, revenue.
Try it →
Financial Docs & Models
Cap Table Scenario Model
Get dilution scenario analysis - just enter current cap table, round terms, option pool.
Try it →


Ready when you are
Get your ready-to-use financial health report.
Answer a few questions and get a finance-ready document you can review, edit and share today.
Get your ready-to-use financial health report